iPLAN- Module Interval Graphic
FBS offers with this module a widely automated opportunity to create interval graphics. Thereby the clockface timetable system in traffic areas can be visualized very efficiently. Contentual starting points are the graphic timetables of the FBS network, whereby of course also here the integral concept of the uniform data keeping and synchronization of iPLAN holds true.
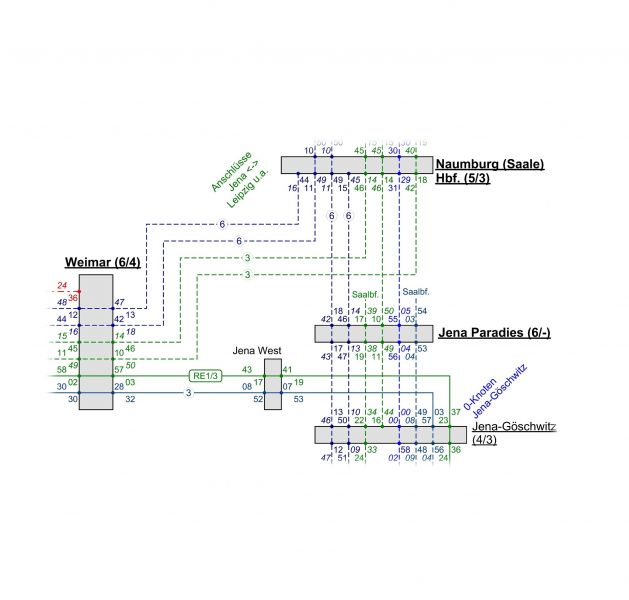
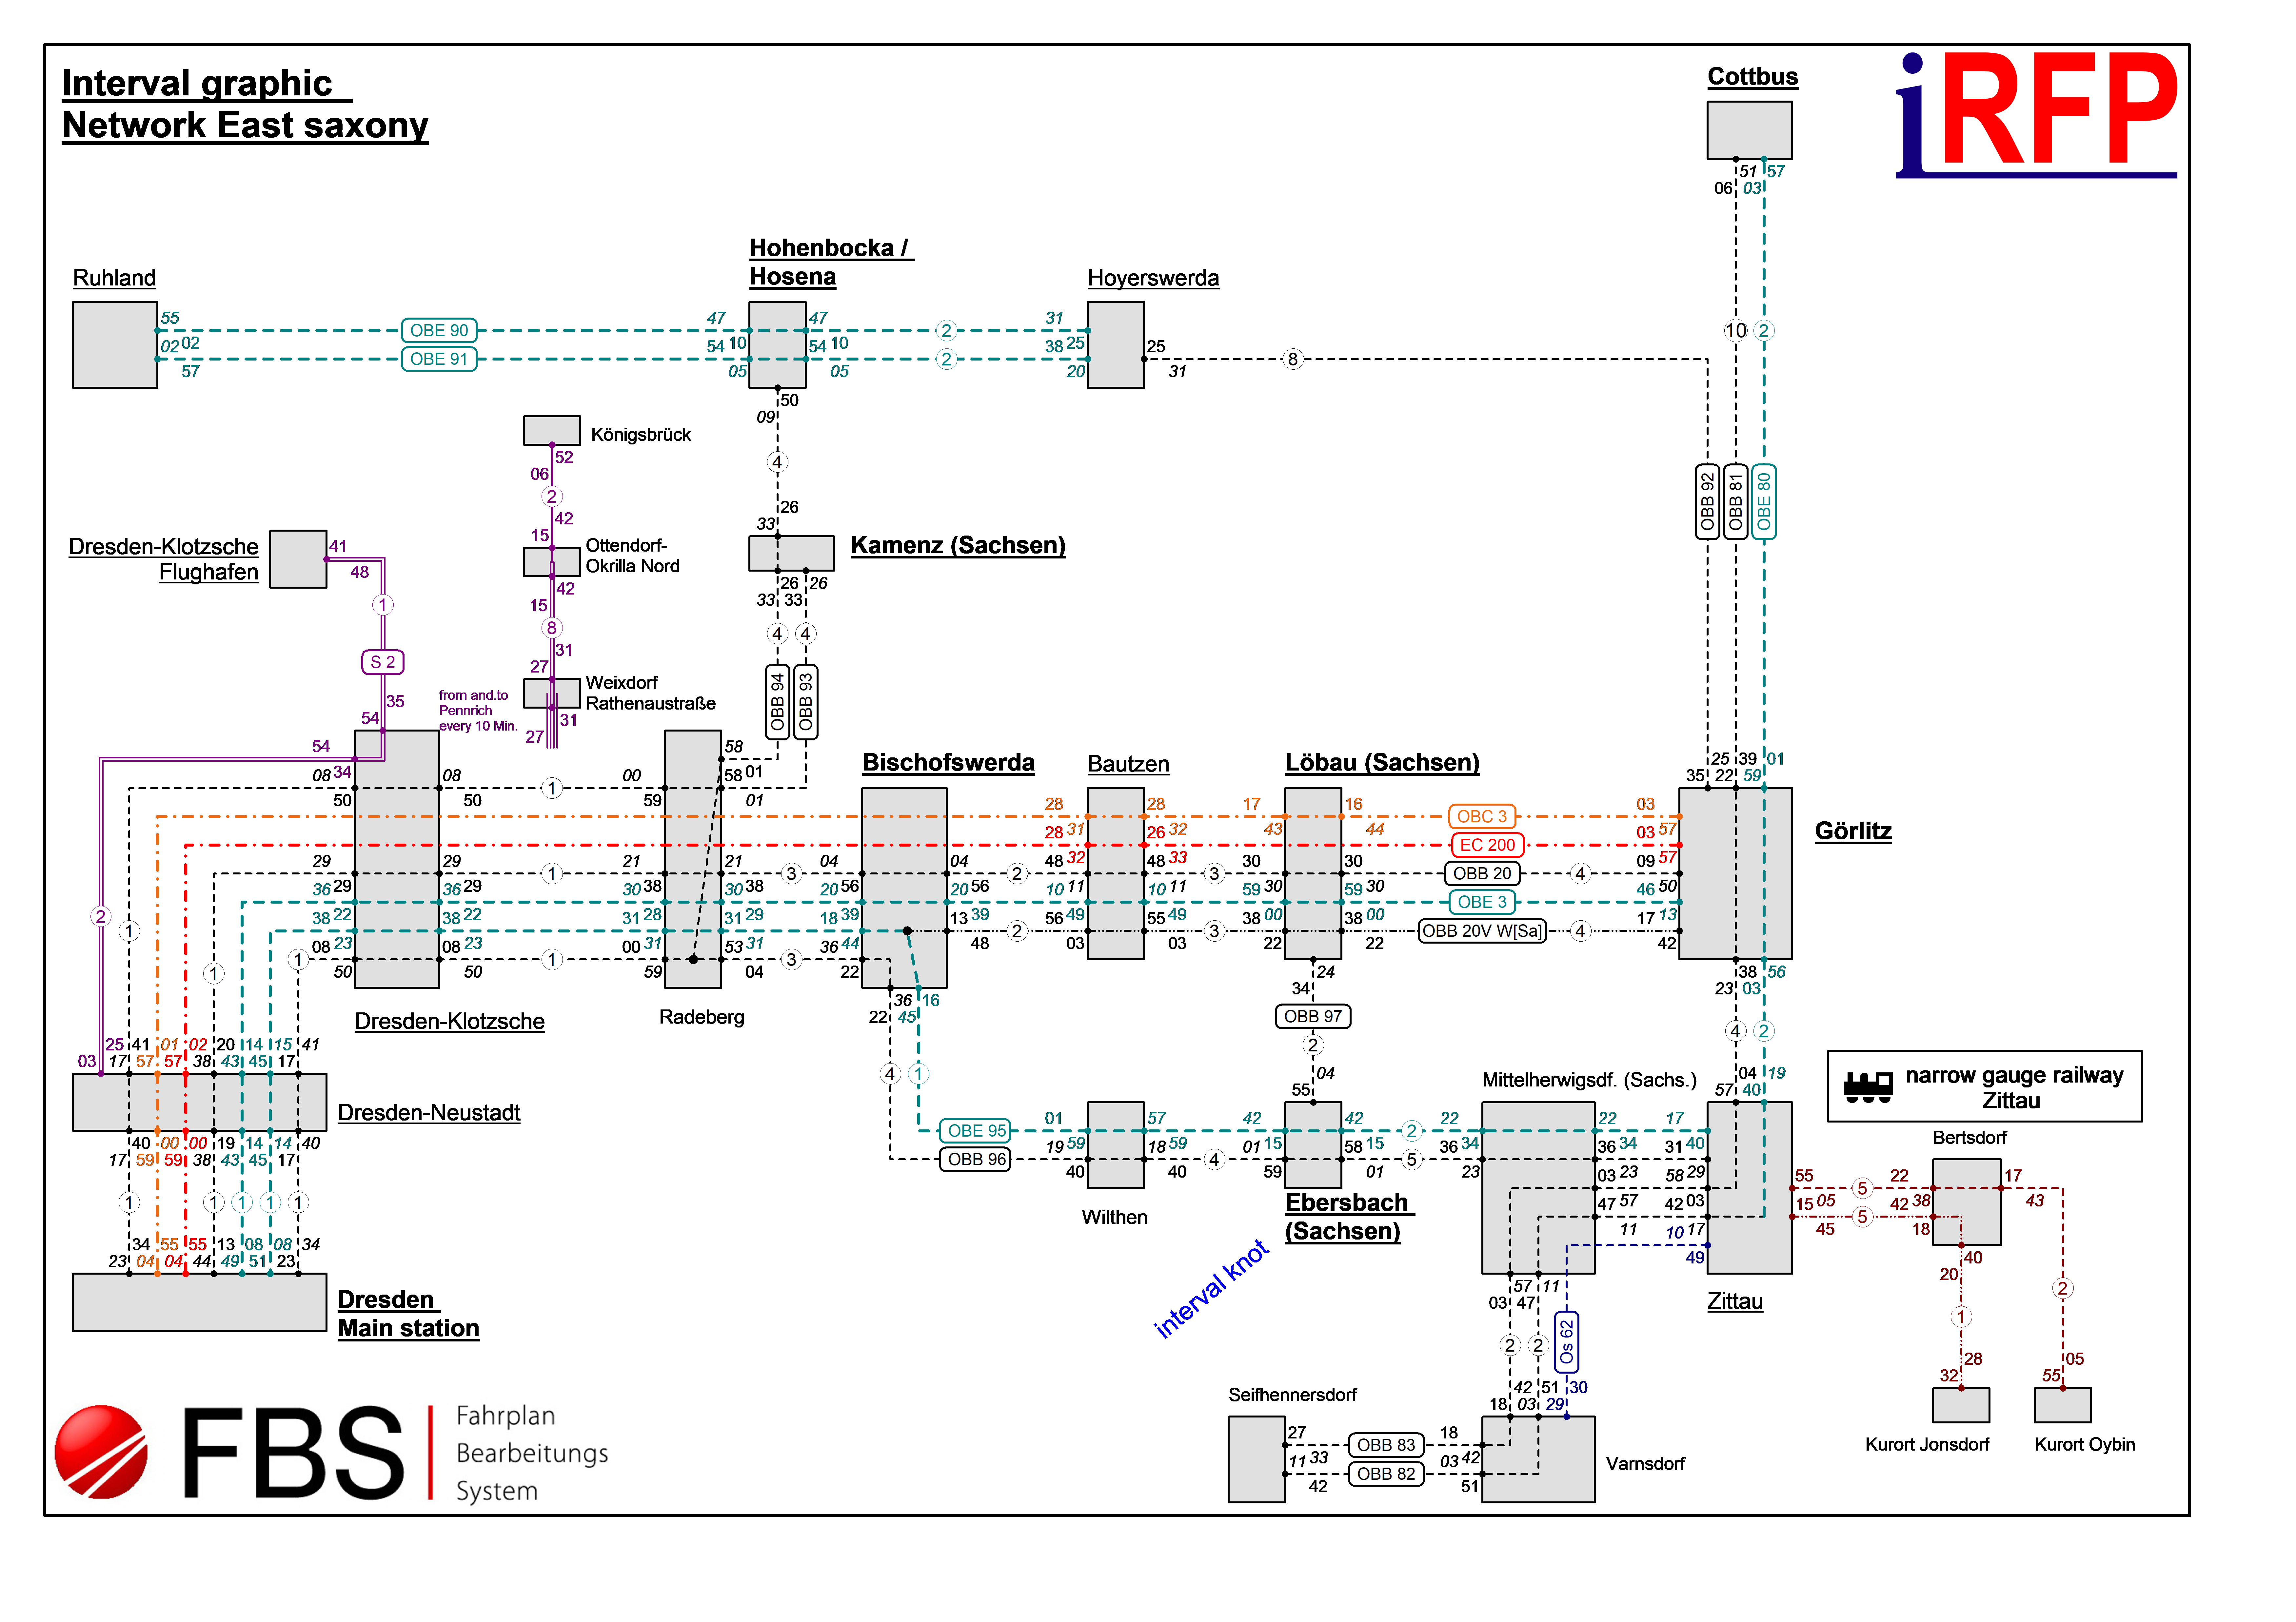
FBS interval graphics are built upon three fundamental elements:
- junctions (depiction of the location spots with arrival and departure or drive through times of the lines)
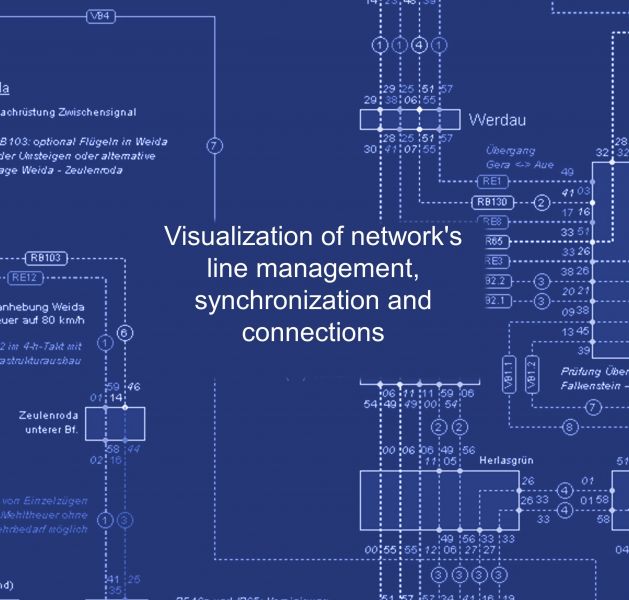
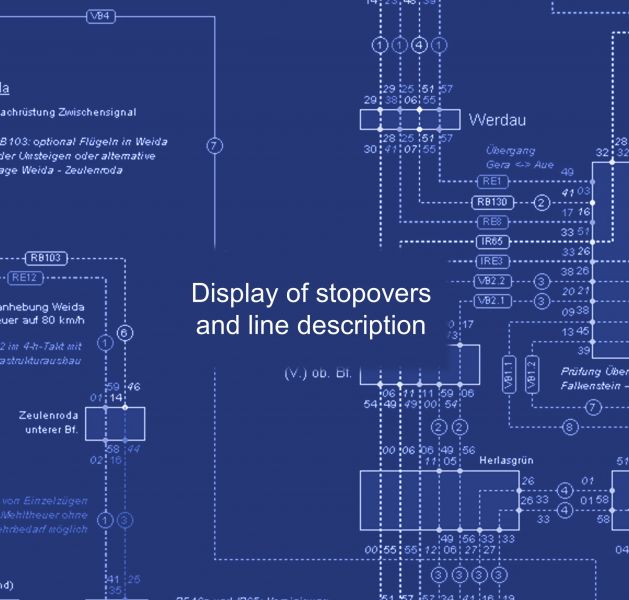
- interval lines (course and frequency of the relation, intermediate stops, offer categories, if necessary labels, coupling and separating)
- graphic elements (additional information, images, -logos, simple geometric forms etc.)

From the graphic timetable to the interval graphics
While the creation of a new interval graphics in the main window of iPLAN selected junction stations and the clocked lines are proposed by the programme. Then the user can adapt and change them manually. The programme orients at the selection of lines on the interval group information of the graphic timetables to recognize clocked trains and their interval time. General interval graphics can be created out of simple exemplary interval graphic timetables, that means therefore the complete construction of timetables isn't necessary.
Alternatively, it is possible to set exemplary interval trains manually, when the graphic timetables do not contain the interval group information. In this case a single train with it's arrival and departure minutes is symbolic for a clocked line, the interval time then has to be indicated by the user.
Predefined line types are available for 15-, 20-, 30-, 60-min- as well as for 2- und 4-h intervals. More frequent offers are mapped by combinations. Also unclocked lines can be (depending on the availability of the timetable situation) presented, too.
Individual construction of the graphics
The position of the interval junctions in the interva graphics is first set by the programme, if geograpfic coordinates are included in the station database. Mostly a distribution of the junctions on the page is carried out afterwards according to individual wishes. You can rework FBS interval graphics manual as needed. But adjustments are limited generally to a correction of lines between the junctions - by insertion or relocating of so called support points - for the purpose of Avoiding overlaps as well as to a lebeling for example with individual information and headlines.
With graphical elements or explaining texts explanatory power can be increased even further, e.g. by including hints on planning states or necessary infrastructural measures. Also useful are statements about the itinerary of breaking in and out lines, that means such, which are contained in the map or in the based network only partially.
To make the positioning of all elements easier for the user a grid can be prescribed. For a subsequent adjustment of the finished graphics with all of the included elements, e.g. during a change of the format or the asic layout, help functions are offered.
FBS interval graphics can be printed on all unter Windows® configurated printers and plotters in all fomats upwards from DIN A4. FBS provides a print preview, a printout ("detour") in various graphic formats and an autonomous creation of PDF-files (Portable Document Format, Postscript® Page Description Language).